| Issue 101 | Dec 9th 2010 | Contact the Editor | How to Contribute |
|
| ||
|
Reports That Steal The Show - Part 1
This article, the
first in a series (Part 1
of 3), shows how to create a LiveCode application that uses the
SpecialFolders
Path, CustomProperties and revBrowser
to
render charts in LiveCode. In this article I’ll show, step by step, how
this
file was created to generate charts in a Mac and Windows environment. FusionCharts (swf,
css, js and html files)
are used to enable you to “bolt on” charting functionality to your
LiveCode
solutions. To create reports in LiveCode using these components, you
need to
have LiveCode 4.5.0 (or above). These components use the revBrowser
object of
LiveCode to render charts, graphs and maps that are driven by data
present in
your LiveCode solution. SpecialFolders
and CustomProperties
were dealt with in previous articles, in this article we show how to
use them
to import the files from a folder, then CustomProperties are used to
store the
imported files. Subsequently, SpecialFolders will be used to export
these files
from their CustomProperties storage to a temporary storage area. i.e.
Folder. I’m
new to LiveCode , with
some FileMaker (FMP) charting experience) This same methodology is used
in
LiveCode to obtain the path to temporary storage on Mac/Win, during a
given
session. During a session, chart files can be imported, which need be
done only
once. Then, during each subsequent session, these imported files are
automatically exported to a temporary folder. Next, when requested,
report
information is assembled and a URL string is created for chart
rendering. The
first part of the URL string, points to the location of the chart files
followed by the chart report info. This URL string is passed to a
revBrowser
and the chart is rendered. So,
I’m on a mission to show
you how to replicate this charting functionality in LiveCode. A special thanks to Mark Weider, showing this LiveCode
newbie how
CustomProperties work. Mark has recently finished a CustomProperties
lesson,
which can be found here.
Another big thanks, to Chipp
Walters
who gave me the revBrowser tip which allows revBrowser usage in the
same stack
with other cards. Simple, but powerful: closeBrowser when navigating to
other
cards in the same stack. Chipp also wrote: “This
is due to the fact that
revBrowser is actually an evolution of the altBrowser external created
years
ago by Altuit. Because of this, there are several limitations as to how
it
works as an external interface for LiveCode and can only 'do so much.' For
instance, revBrowser
actually opens a window OVER a stack. The window tracks the stacks
movement,
but not the card to card movement, this is why it continues to show
when you go
from a card to card. But, you can easily close it using a preOpenCard
command.
Many of the other refinements you mention, while very good and
interesting as a
native control, can not happen with an external such as revBrowser and
so must
be explicitly coded by the developer.” Another special thanks to Zyrip
of DataGrid Helper
fame. Zryip performed beta testing when the file was
in Rev and subsequently migrated to LiveCode. Zryip was responsible for
illuminating the code aspects required when rendering charts on the
Mac. He
reported that the Mac revBrowser “chokes” when the chart URL string
contains
“cr” and/or spaces, i.e., “%20”. This condition is not present when the
revBrowser is in a Windows environment. The Mac solution he
recommended, which
works, is to filter the removal of these characters from the URL
string. Zyrip
also recommended stricter object parameters which improved those GUI
objects
positioning and characteristics. While
learning LiveCode
revBrowser functionality, I created a stack that shows the LiveCode
developer
“how to”
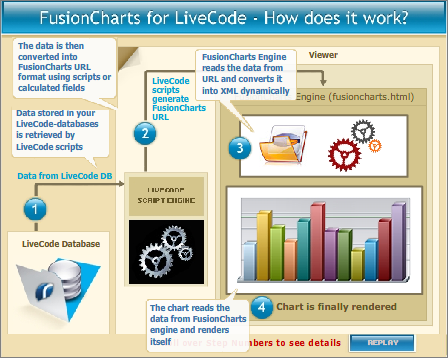
FusionCharts
for
LiveCode How Does It Work?
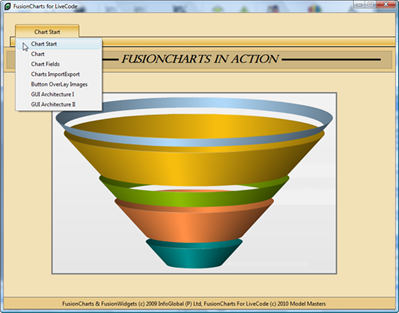
Click the above image to see FusionCharts in action - opens swf in new window FusionCharts
Architecture
FusionCharts
for
LiveCode Cards
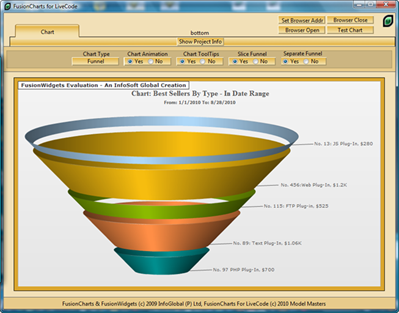
Figure 2 – Chart Start Start Card, navigate to any card
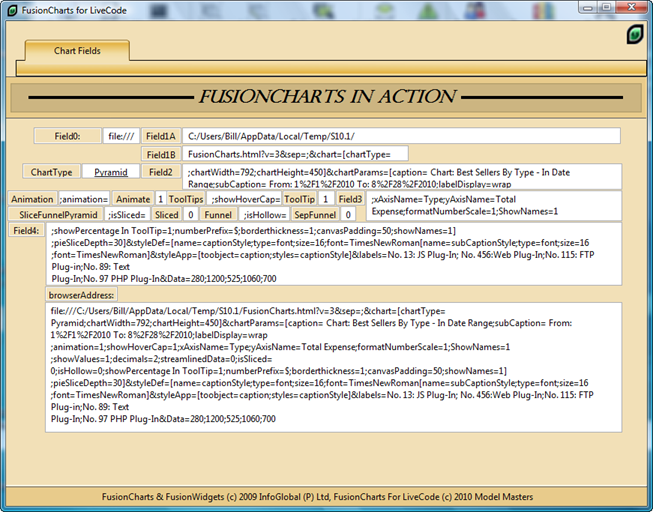
Figure 4 – Chart Fields URL, chart type, selectable chart behavior
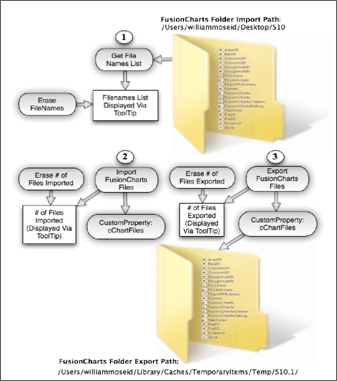
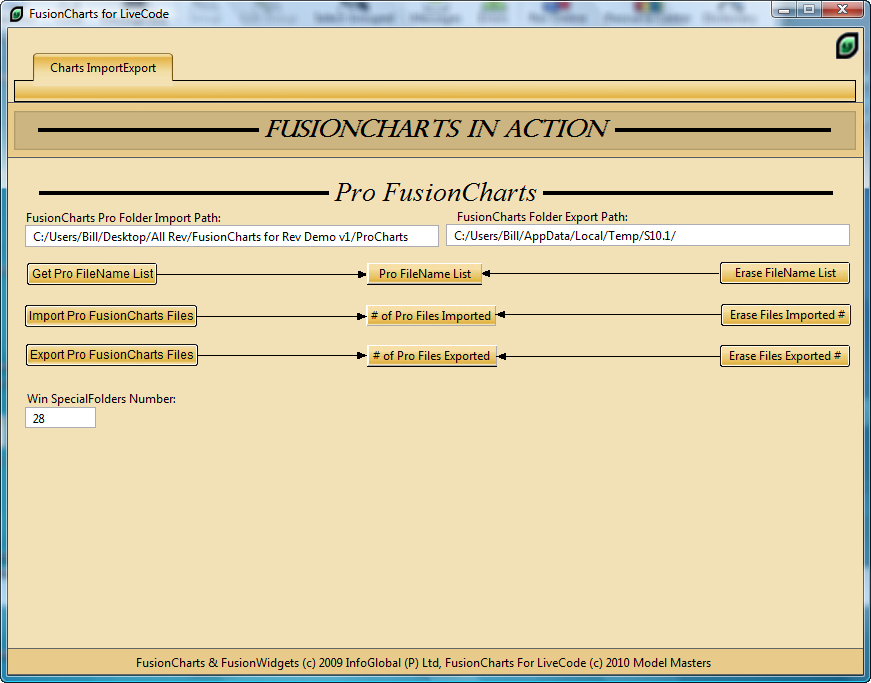
Figure 5 - Chart ImportExport
Figure
6 – Button OverLay Images All
button and image skins: Blue, Gold, White
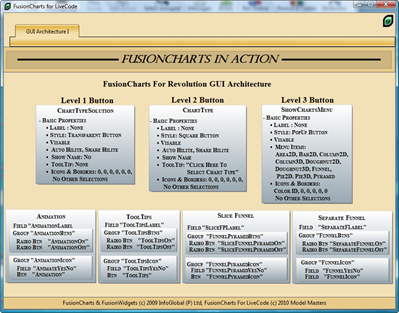
Figure 7 – GUI Architecture I
Slice Funnel/Pyramid and Separate Funnel Groups
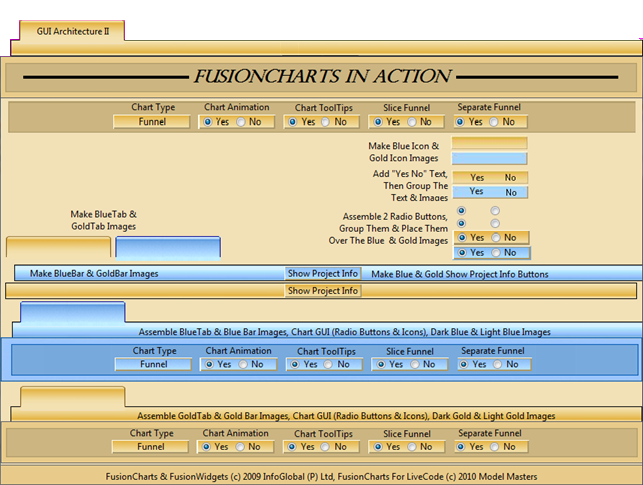
Figure 8 – GUI
Architecture II Composition Info For
Tabs, Buttons, Bars, Icon Groups, Stack
Architecture The FusionCharts For LiveCode file is composed of one stack with 7 cards which are named:
o Charts List, Animation, ToolTips, Funnel & Pyramid Chart Slice/No Slice and Funnel Chart Segment Separation/No Segment Separation Selections
o Import FusionCharts Files, # of Pro Files Imported; Erase # of Pro Files Imported, Set Highlights of Import FusionCharts Files Buttons To True/False & Set ToolTips o Export FusionCharts Files, # of Pro Files Exported; Erase # of Pro Files Exported & Set Highlights of Export FusionCharts Files Buttons To True/False & Set ToolTips
o All Images & Button Used For Card Objects Buttons and Image Skinning o The Blue & Gold Tabs When Clicked, Run A Script Which Sets Their Blue/Gold GUI Color Of The Objects In All Cards
o GUI Architecture Overview
o Graphic Representation Of The Various Objects & GUI Used In This File This
Card and all the other cards,
have a Navigation Tab and Bar near the top of the card.
The Tab and Bar are images. Over the Tab image is a Pulldown button which displays that card name. The Menu Items in this button are the names of the stack’s 7 cards: Chart Start, Chart, Chart Fields, Charts ImportExport, Button OverLay Images, GUI Architecture I and GUI Architecture II. When the Tab Pulldown button is clicked and a card name is selected from the list, navigation proceeds to that card. A Navigation Tab and Bar are in the same location near the top of each card.
On
each of the 7 cards, the bar under the Navigation Tab contains a ToolTip and a script (Thanks to
Ben Beaumont). When
the mouse is hovered over that bar, a ToolTip appears. If you respond
to the
ToolTip’s advice, namely that “ .
. . on
the top of each Bar is a hidden button containing the “Show Project
Info”
button, when the Bar is clicked, the “Show Project Info” button
appears.
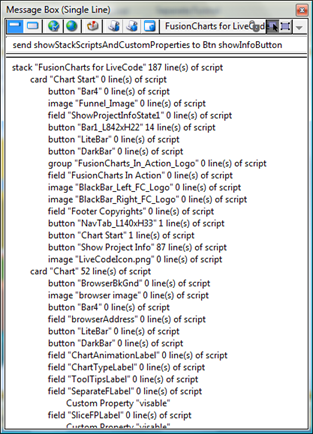
Clicking that button opens the Message Box which displays the Project
Info for
the stack and each card in that stack, as shown in the following
figure. I’ve
used this technique for many things, including finding and deleting or
renaming
objects to identify their type/purpose.
Figure 11 – Message Box
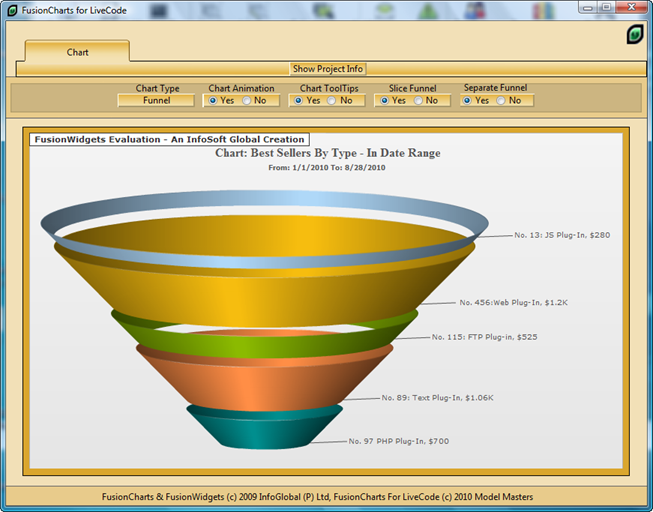
Figure 12 –
Card Chart, Show Project Info Button The following script is located in each of the seven Show Project Info buttons, which are on each of the 7 cards in this stack: /-- Author: Ben Beaumont -- Creation Date: 04/03/2010 -- About This Script: --Collects Stack & Card Info & Displays The Result In The -- Message Box Window -- History -- Modifier: William Roger Moseid -- Date: 08/16/2010 -- Added Code To Automatically Run: -- The showStackScriptsAndCustomProperties Script -- This script was found here: -- -- http://lessons.runrev.com/spaces/lessons/buckets/784/lessons/12625 -- The output of running this Script is Displayed In The -- Message Window. You Will See -- Stacks, Cards, Controls & Custom Properties Details. -- The Code Iterates Through The Mainstack And Substacks And -- For Each Of These -- Goes Through The Cards, Then Controls On The Cards. -- At Each Stage, It Also Looks For Custom Properties. -- All Output Is Sent To The Message Box. --/ on mouseUp -- Prepare To Empty Message Box hide message box -- Clear Message Box Results Window put "" -- Display It show message Box -- Get & Show Project Info call "showStackScriptsAndCustomProperties" of btn \ "Show Project Info" end mouseUp on showStackScriptsAndCustomProperties local tStack, tCard, tControl, tScript, tStacks, tSubStacks, \ tKey, tPropertyKeys put the name of this stack into tStacks put the substacks of this stack into tSubStacks repeat for each line tStack in tSubStacks put return & the name of stack tStack after tStacks end repeat put empty into msg repeat for each line tStack in tStacks put the script of the stack tStack into tScript put tStack && the number of lines of tScript & \ " line(s) of script" & return after msg put the customKeys of stack tStack into tPropertyKeys repeat for each line tKey in tPropertyKeys put tab & "Custom Property" && quote & tKey & quote & return \ after msg end repeat put 0 into tCard repeat for the number of cards in the stack \ tStack add one to tCard put the script of card tCard of stack tStack into tScript put tab & the name of card tCard of stack tStack &&\ the number of lines of tscript & " line(s) of script" & return \ after msg put the customKeys of card tCard of stack tStack into \ tPropertyKeys repeat for each line tKey in tPropertyKeys put tab & tab & "Custom Property" && quote & tKey & quote & \ return after msg end repeat put 0 into tControl repeat for the number of controls of card tCard of stack tStack add one to tControl put the script of control tControl of card tCard of stack \ tStack into tScript put tab & tab & the name of control tControl of card tCard of \ stack tStack && \ the number of lines of tscript & " line(s) of script" & return \ after msg put the customKeys of control tControl of card tCard of stack \ tStack into tPropertyKeys repeat for each line tKey in tPropertyKeys put tab & tab & tab & "Custom Property" && quote & tKey & \ quote & return after msg end repeat end repeat end repeat end repeat Figure 12 -
Show Project Info Script /-- Author: William Roger Moseid -- Creation Date: 07/05/2010 -- About This Script: -- Process FusionCharts Type Selection -- History -- Modifier: <First, Middle, Last Name> -- Date: mm/dd/yyy --/ on menuPick pItemName set the label of Btn "ChartType" to pItemName If pItemName is "Funnel" then send "mouseUp" to grp "FunnelPyramidBtns" else If pItemName is "Pyramid" then send "mouseUp" to grp "FunnelPyramidBtns" -- Chart Type Is Not Funnel Or Pyramid If pItemName is "Area2D" or pItemName is "Bar2D" or pItemName \ is "Column2D" or pItemName is "Column3D" or pItemName is \ "Doughnut2D" or pItemName is "Doughnut3D" or pItemName is \ "Pie2D" or pItemName is "Pie3D" then hide btn "FunnelPyramidIcon" then hide grp "FunnelPyramidIcon" then hide grp "FunnelPyramidBtns" then hide grp "FunnelIcon" then hide grp "FunnelBtns" then hide Fld "SliceFPLabel" then hide Fld "SeparateFLabel" end if put label of btn "ChartType" into fld "ChartType" of card \ "Chart Fields" of this stack call "setbrowserAddress" of card "Chart Fields" of this stack -- Display Selected Chart call "makeChart" end menuPick Figure 13 -
FusionCharts Type Selection Script /-- Author: William Roger Moseid -- Creation Date: 07/05/2010 -- About This Script: -- Chart Animation: Manages The AnimationBtns Group -- Sets The Group ToolTips Based On The Radio Buttons Set By -- The User -- Calls The "setbrowserAddress" Script of This Card -- If The Radio BUtton Settings Change The MakeChart Script Is -- Called -- History -- Modifier: <First, Middle, Last Name> -- Date: mm/dd/yyy --/on mouseUp If the hilitedButtonName of group "AnimationBtns" is \ "AnimateOff" then set label of group "AnimationBtns" to "0" then set ToolTip of btn"AnimationIcon" to "Click Yes" & \ cr & "To Select" & cr & "Animation" then set ToolTip of btn "AnimateOn" to "Click Yes" & cr & \ "To Select" & cr & "Animation" then set ToolTip of btn "AnimateOff" to "Click Yes" & cr \ & "To Select" & cr & "Animation" then set ToolTip of fld "AnimateYesNo" to "Click Yes" & \ cr & "To Select" & cr & "Animation" else if the hilitedButtonName of group "AnimationBtns" is \ "AnimateOn" then set ToolTip of btn "AnimationIcon" to "Click No" & \ cr & "To DeSelect" & cr & "Animation" then set ToolTip of btn "AnimateOn" to "Click No" & cr & \ "To DeSelect" & cr & "Animation" then set ToolTip of btn "AnimateOff" to "Click No" & cr & \ "To DeSelect" & cr & "Animation" then set ToolTip of fld "AnimateYesNo" to "Click No" & cr \ & "To DeSelect" & cr & "Animation" then set label of group "AnimationBtns" to "1" end if put label of group "AnimationBtns" into fld "Animate" of \ card "Chart Fields" of this stack put label of btn "ChartType" into fld "ChartType" of card \ "Chart Fields" of this stack call "setbrowserAddress" of card "Chart Fields" of this stack -- Display Selected Chart call "makeChart" end mouseUp Figure 14 –
Chart Animation Script /-- Author: William Roger Moseid -- Creation Date: 07/05/2010 -- About This Script: -- Chart ToolTips: Manages The ToolTips Btns Group -- Sets The Group ToolTips Based On The Radio Buttons Set By -- The User -- Calls The "setbrowserAddress" Script of This Card -- If The Radio Button Chart ToolTips Settings Change The -- MakeChart Script Is Called -- History -- Modifier: <First, Middle, Last Name> -- Date: mm/dd/yyy on mouseUp If the hilitedButtonName of group "ToolTipsBtns" is \ "ToolTipsOff" then set label of group "ToolTipsBtns" to "0" then set ToolTip of btn "ToolTips" to "Click Yes" & cr & \ "To Select" & cr & "ToolTips" then set ToolTip of btn "ToolTipsOn" to "Click Yes" & cr \ & "To Select" & cr & "ToolTips" then set ToolTip of btn "ToolTipsOff" to "Click Yes" & cr \ & "To Select" & cr & "ToolTips" then set ToolTip of fld "ToolTipsYesNo" to "Click Yes" & \ cr & "To Select" & cr & "ToolTips" else if the hilitedButtonName of group "ToolTipsBtns" is \ "ToolTipsOn" then set label of group "ToolTipsBtns" to "1" then set ToolTip of btn "ToolTips" to "Click No" & cr & \ "To DeSelect" & cr & "ToolTips" then set ToolTip of btn "ToolTipsOn" to "Click No" & cr & \ "To DeSelect" & cr & "ToolTips" then set ToolTip of btn "ToolTipsOff" to "Click No" & cr \ & "To DeSelect" & cr & "ToolTips" then set ToolTip of fld "ToolTipsYesNo" to "Click No" & \ cr & "To DeSelect" & cr & "ToolTips" end if put label of group "ToolTipsBtns" into fld "ToolTip" of card \ "Chart Fields" of this stack put label of btn "ChartType" into fld "ChartType" of card \ "Chart Fields" of this stack call "setbrowserAddress" of card "Chart Fields" of this stack -- Display Selected Chart call "makeChart" end mouseUp Figure 15 –
Chart ToolTips Script /-- Author: William Roger Moseid -- Creation Date: 06/05/2010 -- About This Script: -- Process Chart Slice Funnel/Pyramid Selection -- History -- Modifier: <FirstName> <LastName> -- Date: nn/dd/yyyy -- <Changes> --/ on mouseUp If the hilitedButtonName of group "FunnelPyramidBtns" is \ "SliceFunnelPyramidOff" then set label of group "FunnelPyramidBtns" to "0" then hide group "FunnelBtns" then hide group "FunnelIcon" then hide fld "SeparateFLabel" then set ToolTip of btn "FunnelPyramid" to "Click Yes To" \ & cr & "Select Slice" & cr & label of btn "ChartType" then set ToolTip of btn "SliceFunnelPyramidOn" to \ "Click Yes To" & cr & "Select Slice" & cr & label of btn "ChartType" then set ToolTip of btn "SliceFunnelPyramidOff" to \ "Click Yes To" & cr & "Select Slice" & cr & label of btn "ChartType" else if the hilitedButtonName of group "FunnelPyramidBtns" \ is "SliceFunnelPyramidOn" then set label of group "FunnelPyramidBtns" to "1" then show grp "FunnelPyramidIcon" then show grp "FunnelPyramidBtns" then hide group "FunnelBtns" then show grp "FunnelIcon" then show grp "FunnelBtns" then show fld "SliceFPLabel" then put "Slice Funnel" into Fld "SliceFPLabel" then show fld "SeparateFLabel" then set ToolTip of btn "FunnelPyramid" to "Click No To " \ & cr & "DeSelect Slice" & cr & label of btn "ChartType" then set ToolTip of btn "SliceFunnelPyramidOn" to \ "Click No To " & cr & "DeSelect Slice" & cr & label of btn "ChartType" then set ToolTip of btn "SliceFunnelPyramidOff" to \ "Click No To " & cr & "DeSelect Slice" & cr & label of btn "ChartType" end if If label of btn "ChartType" is "Pyramid" --then show btn"FunnelPyramidIcon" then show grp "FunnelPyramidIcon" -- Hide these Groups then hide grp "FunnelIcon" then hide grp "FunnelBtns" then hide Fld "SeparateFLabel" then put "Slice Pyramid" into Fld "SliceFPLabel" then show Fld "SliceFPLabel" end if put label of group "FunnelPyramidBtns" into fld "Sliced" \ of card "Chart Fields" of this stack --put label of btn "ChartType" into fld "ChartType" of card -- "Chart Fields" of stack "FusionCharts for Rev" call "setbrowserAddress" of card "Chart Fields" of this stack -- Display Selected Chart call "makeChart" end mouseUp Figure 16 – Chart
Slice Funnel/Pyramid Script /-- Author: William Roger Moseid -- Creation Date: 06/05/2010 -- About This Script: -- Process Chart Separate Funnel Selection -- History -- Modifier: <FirstName> <LastName> -- Date: nn/dd/yyyy -- <Changes> --/ on mouseUp If the hilitedButtonName of group "FunnelBtns" is \ "SeparateFunnelOff" --Hide grp "FunnelBtns" then set label of group "FunnelBtns" to "0" then set ToolTip of btn "Funnel" to "Click Yes" & cr & \ "To Select" & cr & "Separate" & cr & label of btn "ChartType" then set ToolTip of btn "SeparateFunnelOn" to "Click Yes" \ & cr & "To Select" & cr & "Separate" & cr & label of btn "ChartType" then set ToolTip of btn "SeparateFunnelOff" to \ "Click Yes" & cr & "To Select" & cr & "Separate" &\ cr & label of btn "ChartType" then set ToolTip of fld "FunnelYesNo" to "Click Yes" & cr \ & "To Select" & cr & "Separate" & cr & label of btn "ChartType" else if the hilitedButtonName of group "FunnelBtns" is \ "SeparateFunnelOn" then set label of group "FunnelBtns" to "1" then set ToolTip of btn "Funnel" to "Click No" & cr & \ "To DeSelect" & cr & "Separate" & cr & label of btn "ChartType" then set ToolTip of btn "SeparateFunnelOn" to "Click No" \ & cr & "To DeSelect" & cr & "Separate" & cr & label of btn "ChartType" then set ToolTip of fld "FunnelYesNo" to "Click No" & cr \ & "To DeSelect" & cr & "Separate" & cr & label of btn "ChartType" then show grp "FunnelBtns" end if put label of group "FunnelBtns" into fld "SepFunnel" of \ card "Chart Fields" of this stack call "setbrowserAddress" of card "Chart Fields" of this stack -- Render Chart Selection call "makeChart" end mouseUp Figure 17– Chart
Separate Funnel Script /-- Author: William Roger Moseid -- Creation Date: 06/05/2010 -- About This Script: -- Chart Processing Scripts -- History -- Modifier: <FirstName> <LastName> -- Date: nn/dd/yyyy -- <Changes> --/ global setBrowserAddress -------------------------------------------------------- on makeChart --Put The URl In The browserAddress Field Into The -- revBrowser To Render The Chart put label of btn "ChartType" into fld "ChartType" of card \ "Chart Fields" of this stack call "setbrowserAddress" of card "Chart Fields" of this stack replace space with "%20" in fld "BrowserAddress" of cd \ "Chart" of this stack replace cr with empty in fld "BrowserAddress" of cd "Chart" \ of this stack browserSetURL fld "browserAddress" of cd "Chart" of this stack end makeChart ------------------------------------------------------- global sBrowserId, tWinID, tBrowserID on openCard browserOpen makeChart end openCard ------------------------------------------------------ on closeCard browserClose end closeCard ------------------------------------------------------ on browserOpen -- We Pass The Windowid Of The Stack To Revbrowser -- So That It Can Determine In Which Window To Place The -- Browser Object put the windowID of this stack into tWinID -- Open The Browser, Using The Windowid And Initial Url put revBrowserOpen(tWinID,"") into sBrowserId put sBrowserId into tBrowserID -- Set Some Basic Properties For The Browser revBrowserSet sBrowserId, "showborder","true" revBrowserSet sBrowserId, "rect",rect of image \ "browser image" end browserOpen ---------------------------------- -- Setup To Close The Browser on browserClose If tBrowserID is not empty then --revBrowserClose sBrowserId revBrowserClose tBrowserId put empty into tBrowserID end If end browserClose ---------------------------------- on browserSetURL pURL ## Set The URLTo Be Displayed To The Given URL revBrowserSet sBrowserId, "url", pURL end browserSetURL Figure 18– Card
Chart revBrowser Scripts Conclusion The SpecialFolders, CustomProperties and revBrowser features in articles 1-3,will enable LiveCode developers to quickly and easily modify their stack files in order to take advantage of this charting Currently there are 46 Trial/Pro swf chart files. This stack uses 10 of the Trial swf files and 9 css, js and html files. The only difference between the Trial and Pro swf files is, Trial swf files have a watermark. In article 2, I’ll continue the discussion of cards Chart Fields and Charts ImportExport (With SpecialFolders and CustomProperties. Article 3 will cover cards Button Overlay Images, GUI Architecture I and GUI Architecture II.
| 

|