Dynamic Bar Charts
Revolution as a tool in bringing complex data to life
A colleague of mine in the physics department was asked by a local publication to express his opinion on the prospect of a meaningful reduction in CO2 emissions if we are to avert the projected adverse effects of climate change. Albert Einstein's advice in dealing with complex problems such as this was to "make it as simple as possible, but not simpler." My friend chose a simple case: Consider just the US, China and India. He looked at the populations and the per capita CO2 emissions for each of the countries. He made a few simple assumptions about the potential changes in population and the per capita emission for each of the three countries and concluded that the odds are greatly against a successful outcome.
With these six variables (3 populations and 3 per capita emission rates) it is possible to calculate the net emissions from these three critical countries: just multiply the capita by the per capita and add them up.
I thought there might be other scenarios than those chosen by my friend that should be considered first before giving up on the issue. To examine these other options I decided to use a tool that I had used earlier in a cost analysis study--more about this later. The thing I love about Revolution is not that it is such a good tool for analysis, like Excel or FileMaker; it isn't. But that it is a utility for making new tools, tools specifically designed for the task at hand. Sure one might throw the data into Excel and fiddle with the variables. Out will pop a variety of results, even a chart or two. But there is a better way. Dramatize the data by making it visually dynamic.
Take a look at the Climate Change stack--I spruced it up a bit for your viewing pleasure.
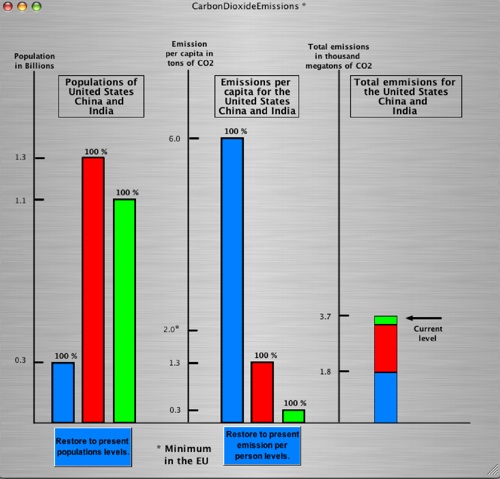
On the left there are three bars representing the populations of the US, China and India. These rectangles slide up and down using the mouse. Just to the right of these are three more bars representing the per capita CO2 emissions for US, China, and India. These also slide. (There is a great deal of variety to be found for this data, depending on how it is measured.) And to the far right are three bars, one atop the other, representing the net CO2 emissions of the US (on the bottom), China (next up) and India (on the top.) These are not user-adjustable. They are calculated in a mouseMove handler that allows them to grow with changes in populations and emissions. (That is so easy in script: Set the bottom of China rectangle to the top of the US rectangle, and the bottom of India to the top of China. You may download the stack here.
Try your hand. Slide the population and emission bars to see if you can reasonably find a way to significantly reduce the net CO2 level below the current value. As a test case you might see what would happen if the US, China and India all changed their per capita CO2 emissions to the minimum level to be found in the EU (see 2.0* on the emissions scale.)
After playing with my Climate Change stack it appeared to me that Al Gore was on a fool's errand. The needed restrictions in populations or individual emissions appeared hopeless. So I went to YouTube to see how Al Gore confronted these facts. His solution is bold, but it needs to be. You can find it here.
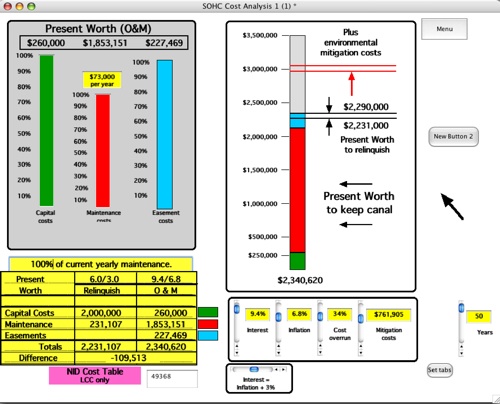
The Climate Change stack is very simple. A more complex example came out of a grassroots project about 5 years ago. Our group SOHC (Save Our Historic Canals) needed to persuade the local Irrigation District that they would save money by keeping a much loved community resource, the Cascade Canal and the associated trail, than by replacing it with a new pipeline. This trail was used by hundreds of people on a daily basis. The cost analysis for the canal was much more complex than the simple example above. The variables were Capital costs, Maintenance costs, Easement costs, Interest, Inflation, Cost overrun, Mitigation costs, and the life of the installed pipe. I won't go into to it here except for the screen shot below.
This stack is a combination of dynamic elements: Three sliding bar graphics and five Revolution sliding scrollbars. As these elements change so does the Present Worth represented by the stack of bars (stack of three on the right, one atop the other) as well as the data table (yellow block, below and left.) We needed to include the data to correlate with the presentation made by District staff.
The five member of the Irrigation District board of directors slept through the staff's analysis. Theirs was all a recitation from charts and tables. I am pleased to say that I had the board's attention with all my sliding bars and ever changing data. It's something like TV. People will watch anything that moves. (I even had an Alan Greenspan pop up with a voice bubble saying "Yikes" when I slid the Inflations scrollbar above 7%.)
I can't say that Revolution saved our canal trail, but it gave us credibility and, after a lot of public pressure, we carried the day.
|