From Data to Chart in 5 Easy Steps
Quartam Reports 1.1.1 Released
Quartam Reports for Revolution version 1.1 was showcased during the keynote at the Revolution Live conference last month, where it was well-received as it introduced stretching data fields and relative positioning, added title and summary sections, brought data groups to everyone and extended the Professional edition with barcodes, 2D charts and export to HTML and Excel.
Earlier this week, Quartam Software released version 1.1.1 of Quartam Reports, the essential report generator for Revolution. This update to Quartam Reports addresses all reported issues and brings a number of enhancements to the brand-new charts on the basis of initial user feedback. You can download the stack that goes with this tutorial here.
As Karen Hughes of Curlypaws put it: "Thanks very much for such a great release! I've been able to significantly improve the output from my program with this latest version - the chart looks great." It is a feature that we are quite proud of, and we decided to show you just how easy it can be to add a report with charts to your application. So download the demo version, fire up Revolution, and we'll get started right away.
Step 1. Create a new stack
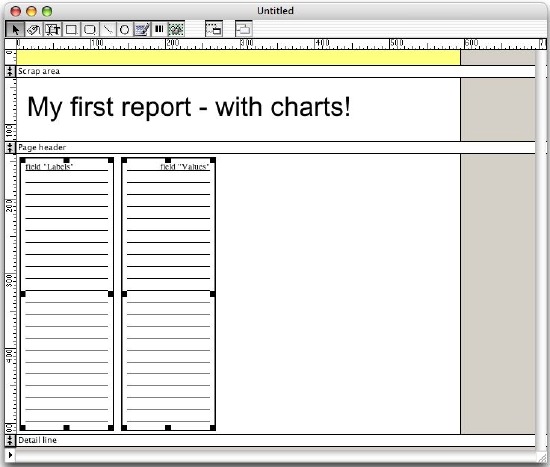
We'll begin with an empty Revolution stack. Drag out two scrolling text fields and a button, resize them a bit and lay them out similar to the screenshot below.
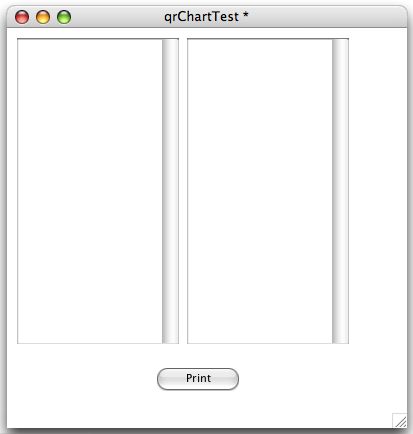
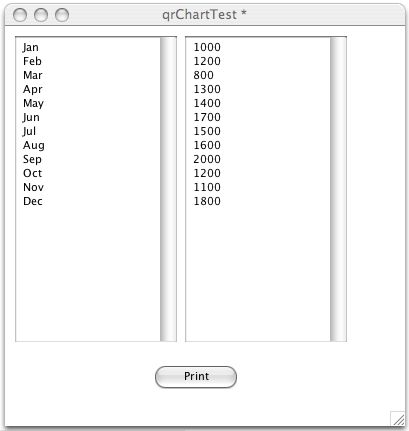
Name the left-hand scrolling field "Labels" and the right-hand scrolling field "Values". Rename the button to "Print", give your stack a meaningful name (such as 'qrChartTest') and save it on your desktop.
Step 2. Create the report layout
Next, open up the QRBuilder application. If this is the first time you've opened it, agree to the terms of the license agreement and then click the 'Evaluate' button. Now you arrive at the 'Welcome' screen, where you can choose to review the samples, create a new report or label set, or open an existing layout.
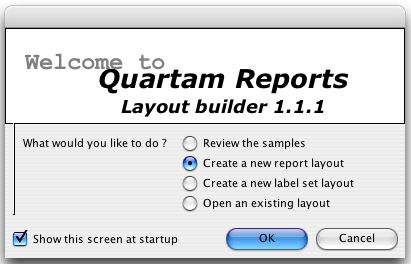
In this case, we're going to create a brand new report layout, so select that radio button and click 'OK' to proceed.
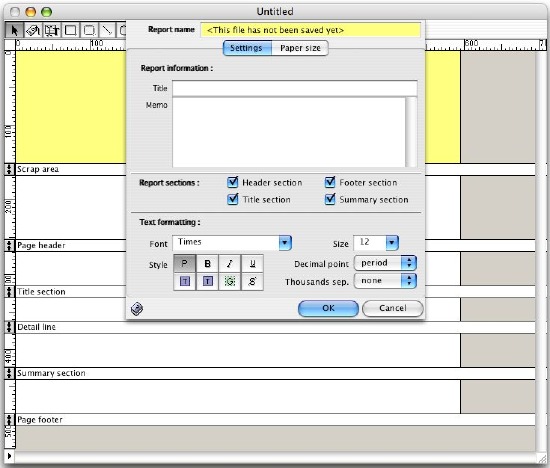
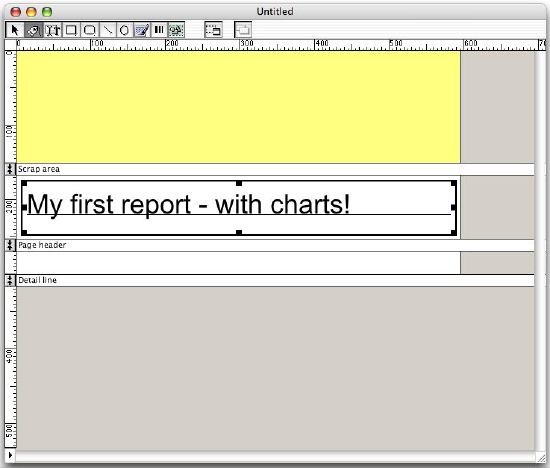
Let's turn off the footer, title and summary sections, and accept the default paper size settings (which happens to be A4). In the layout window, let's use the label tool to draw a text label in the page header section. Use the Properties palette to change its content, font and text size settings.
Next, we make the detail line section a lot bigger and use the data field tool to draw two fields on the left half of the detail line section. Use the Properties palette to set the expression of the left-hand field to field "Labels"; set the expression of the right-hand field to field "Values" and set its alignment to right.
When the report is printed, the Quartam Reports library will automatically replace the data in the fields with the actual data in our stack fields. You may want to tweak the font and size of the data fields a bit before you proceed.
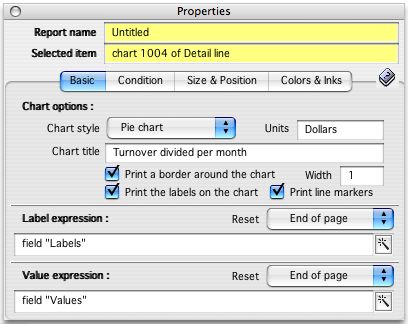
Now we use the chart tool to add a chart on the top right quarter of the detail line section. Use the properties palette to setup the chart as below.
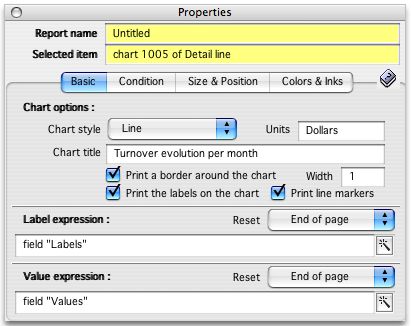
Once more use the chart tool to add another chart to the bottom right quarter of the detail line section. Use the properties palette to setup this second chart as below.
Now we have two charts that will help visualize the raw numbers that we'll be typing into our stack. Just like with data fields, the Quartam Reports library will use the Label and Value expressions to fill the chart with the actual data in your stack fields.
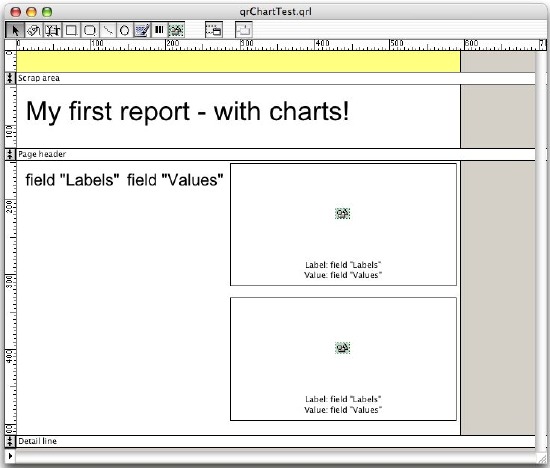
The end result should look something like this. Save this layout in the same directory as the stack we created earlier, and call it 'qrChartTest.qrl'.
Step 3. Prepare your stack
Return to Revolution. Before we can do any printing, we'll need to tell Revolution where it can find the qrtReportslib.rev library file. The easiest way is to add this library stack to the stack files of your project stack. Open the Stack inspector and use the option menu at the top to switch to the Stack files panel.
Click on the folder icon to add the qrtReportsLib.rev stack to the list of stack files.
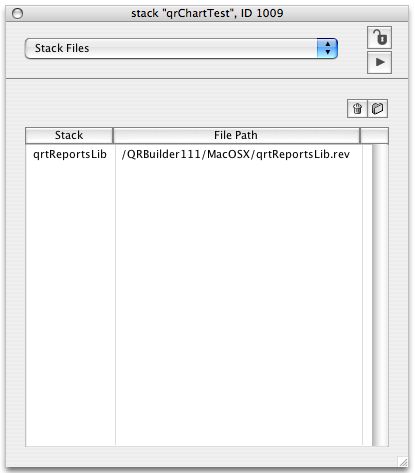
Adding this reference allows us to refer to the library stack directly. As a bonus, Revolution will include the Quartam Reports library when you build a standalone application from this stack.
Let's put some numbers into the fields, so that our final stack looks somewhat like this:
Step 4. The script of the Print button
Now all the infrastructure is prepared - we have a stack, a layout and some data to print. So all we have left to do is write the script of the Print button.
on mouseUp
  ## load the library
  if "qrtReportsLib" is not among the lines of the stacksInUse then
    start using stack "qrtReportsLib"
  end if
  ## prepare for printing
  put AbsolutePath("qrChartTest.qrl") into tLayoutPath
  put the short name of this stack into tStackName
  put true into tPreviewFlag
  put the layer of this card into tCardRange
  ## preview the report on screen
  qrtReports_PrintReportForStack tLayoutPath, tStackName, tPreviewFlag, tCardRange
end mouseUp

function AbsolutePath pRelativePath
  ## this helper function looks for files from the directory where the stack is saved
  put the effective filename of this stack into tAbsolutePath
  set the itemDelimiter to "/"
  put pRelativePath into item -1 of tAbsolutePath
  return tAbsolutePath
end AbsolutePath
##
Step 5. Click the Print button
Let's see the end result: click on the button to get a print preview of this report, including charts:
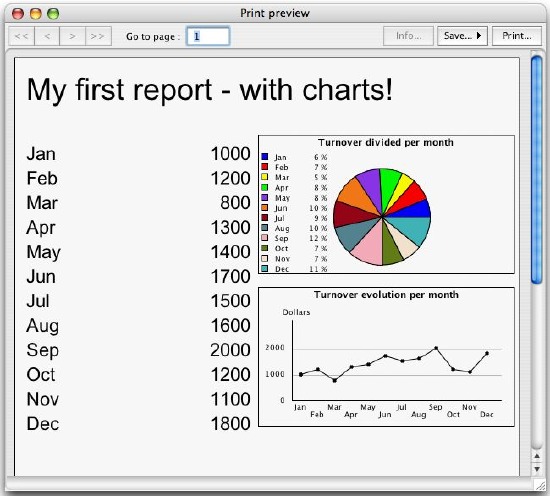
I'll say it again: nothing helps put numbers in perspective like a two-dimensional chart (pun intended) - they visualize proportions and evolutions, helping decision makers spot the trends.
Conclusion
In this example, the data came straight from two fields in a stack. However, you can also let the report library track the labels and values as you're going through a huge record set. Now that you have downloaded Quartam Reports anyway, go to the Help menu, pick the item Review samples - and see for yourself what you can accomplish with a few lines of script and some drawing in the layout builder.
With Quartam Reports, Revolution and just a little SQL, you can create professional reports - cross-platform and database-independent. Quartam Reports 1.1 is a free upgrade for all registered users of Quartam Reports version 1.0 - if you don't have it yet, now is the time to download the demo and purchase your copy.


 | Speaking in Tongues |
| Chorduroy: Revolution Teaches Guitar: Part 3 |
| From Data to Chart in 5 Easy Steps |
| Upcoming Rev Events |