chartsEngine Webinar
Now available, a live walkthrough of chartsEngine with Malte Brill
![]()
Our second revSelect Webinar, focussed on chartsEngine, took place on Tuesday 7th July. It was well attended and feedback has been very positive, thank you all! If you missed it live, you can download the recording here.
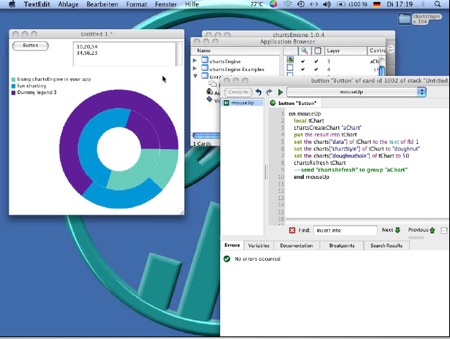
chartsEngine allows you to draw beautiful charts in your Revolution projects with a fraction of the effort of doing it alone. Malte Brill, CEO of DerBrill Multimedia, shows us how to get the best out of this easy to use library. Follow along as he shows us a simple chart, applies different styles, and demonstrates how easy it is to create a customised doughnut chart with just a few lines of script. For the doughnut recipe, all you need is:
- One stack
- One field containing the data
10,20,54
34,56,23
- One button containing this script:
on mouseUp

   local tChart
   chartsCreateChart "aChart"
   put the result into tChart

   set the charts["data"] of tChart to the text of fld 1

   set the charts["chartStyle"] of tChart to "doughnut"
   set the charts["doughnuthole"] of tChart to 50

   chartsRefresh tChart
end mouseUp
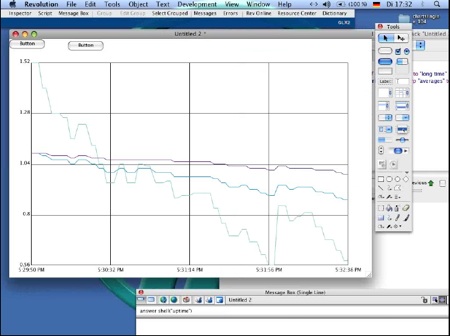
Malte then moves on to discuss how you can create a live chart showing the load on your CPU, in just 20 lines of script. If you'd like to try it, here is the script for your convenience:
local sChart
on mouseUp pMouseBtnNo
   set the flag of me to not the flag of me

   chartsCreateChart "averages",10,40,the right of this cd \
          -10,the bottom of this cd -10

   put the result into sChart
   set the charts["data"] of sChart to empty

   set the charts["dataIncludesX"] of sChart to true
   set the charts["xConvertsTo"] of sChart to "long time"

   if the flag of me then drawData
end mouseUp

on drawData
   local tAverage,tData
   put the charts["data"] of sChart into tData

   set the itemdel to ":"
   put item -1 of shell("uptime") into tAverage

   replace space with comma in tAverage
   put the seconds&taverage into tAverage

   put tAverage&cr after tData
   set the charts["data"] of sChart to tData

   chartsRefresh sChart
   if the flag of me then send "drawData" to me in 2 seconds

end drawData
I hope you find this webinar as useful and entertaining as I did. I'm looking forward to our next one, which will be scheduled for the start of next month.
During July we are offering a special 20% discount on chartsEngine and Studio. You can get the two together using the coupon STUDIOCHARTS20 and save almost $70. You can also get 20% off chartsEngine alone using CHARTS20.
 |
|